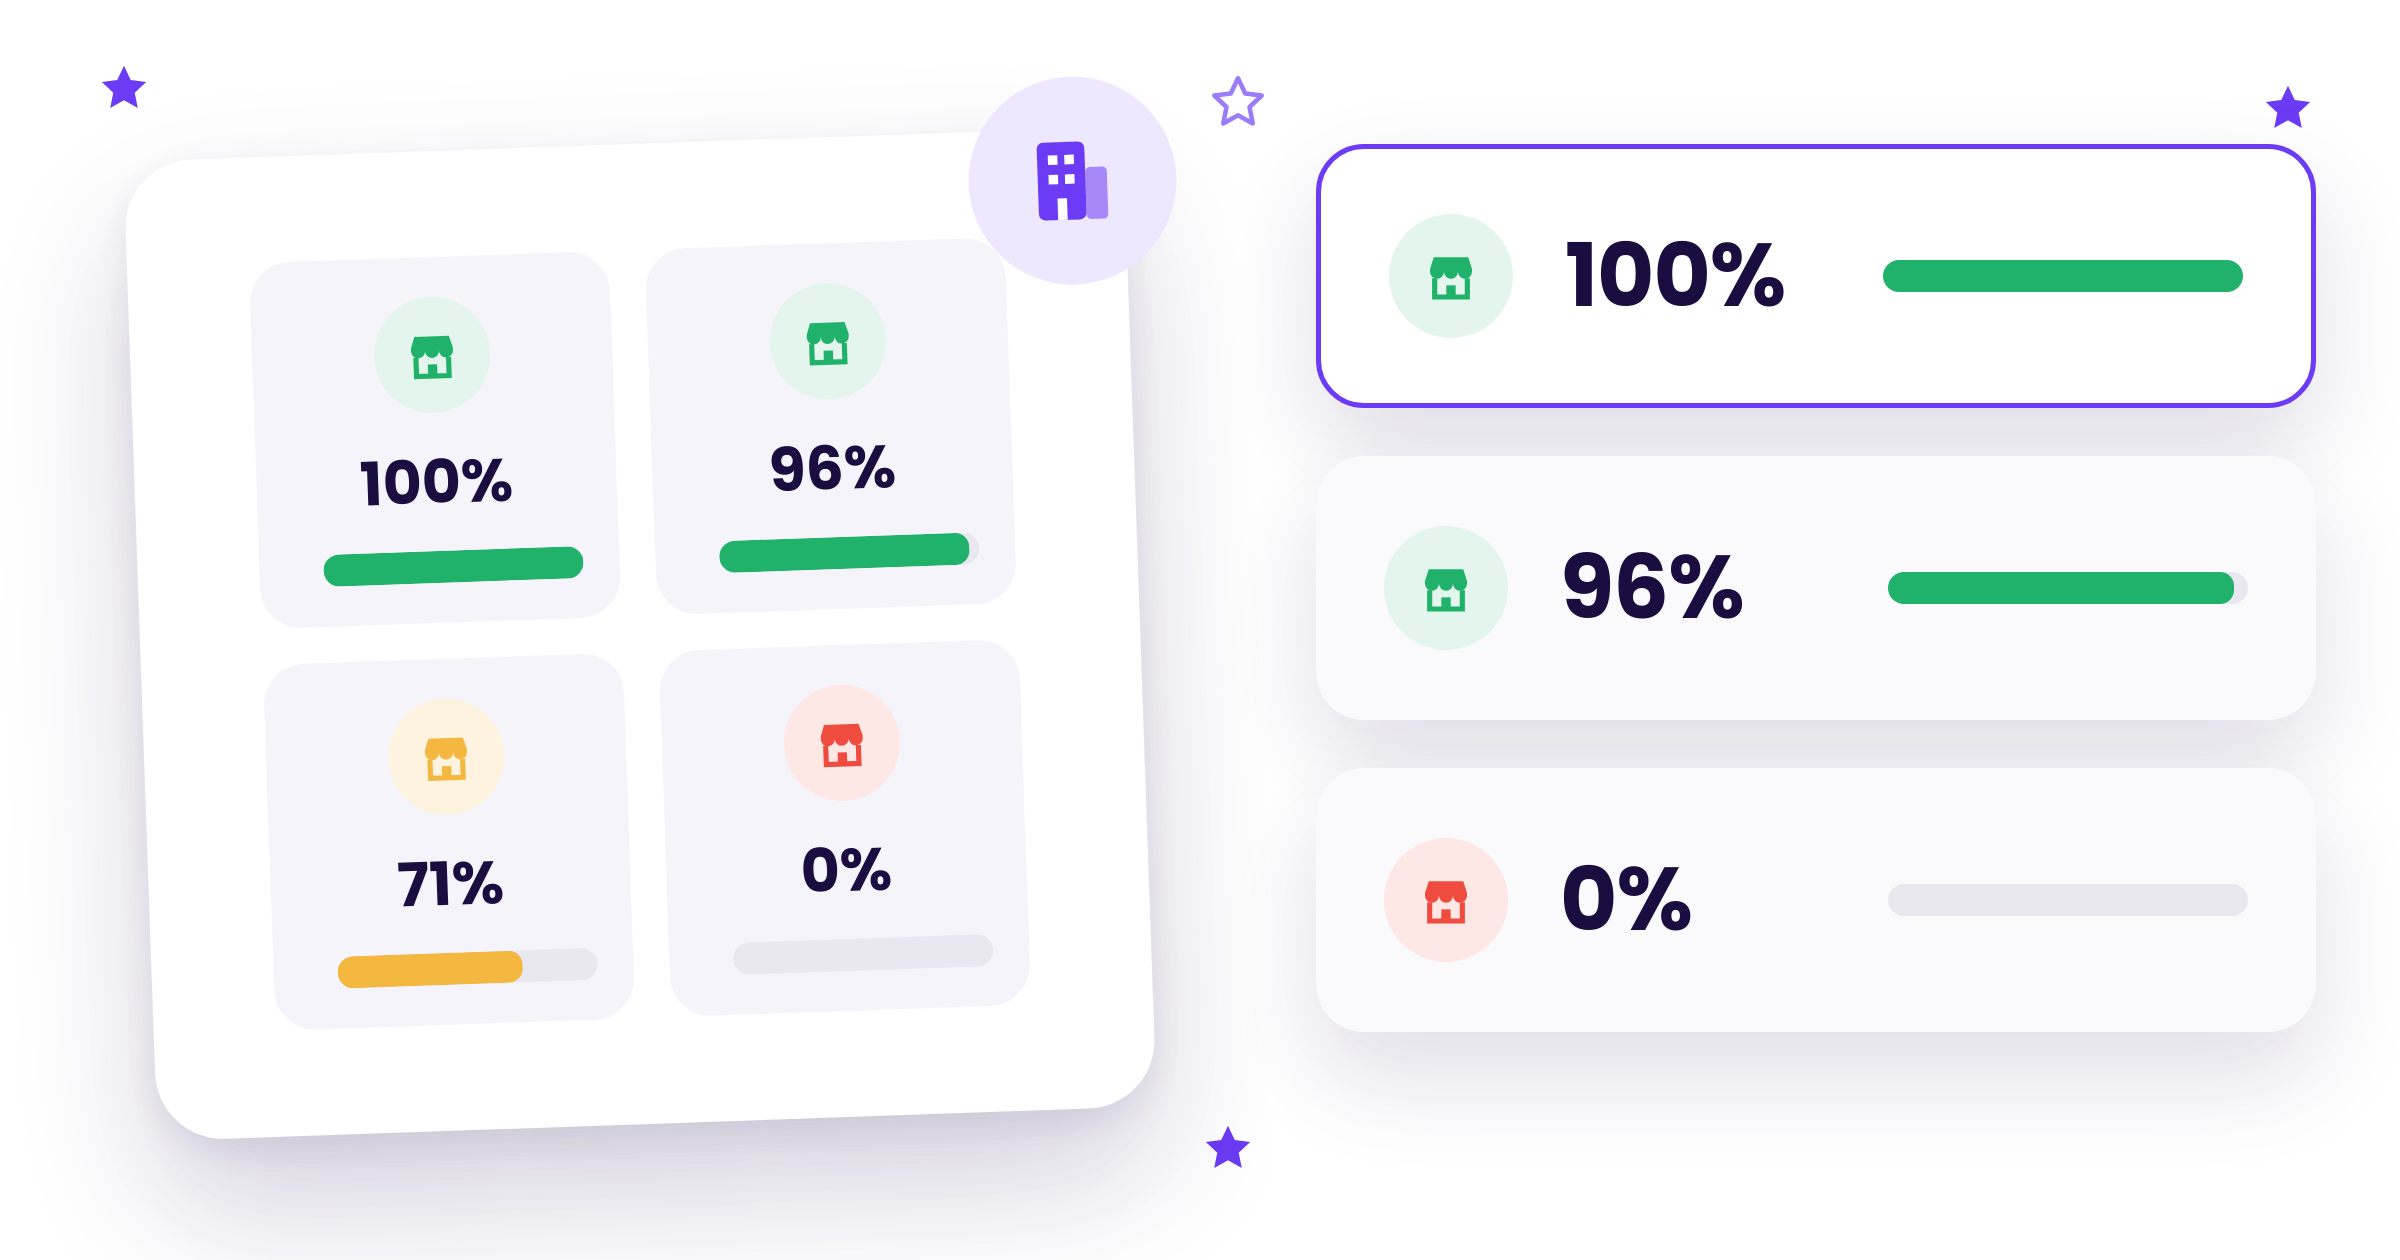

The location gap is the difference in review behaviour between locations of one and the same organisation: same name over the door, completely different behaviour per location. The Reputation Index by Repmanager (the 60 largest dealer groups in the Netherlands, 46,801 Google reviews from August 2025 to July 2026) shows that in 7 of the 21 groups with ten or more measured locations, a location that answers 90 percent or more of its reviews sits next to a location stuck at 10 percent or less. In five groups it is literally 100 next to 0.
The term "the location gap" was introduced by Repmanager, based on the data behind the Reputation Index 2026.
Your customer does not see an organisation. They see the location around the corner. Head office can have a perfectly good review policy, but on Google only what that one location does counts. And that is where it diverges.
| Key figure | What it means |
|---|---|
| 7 of 21 | Groups with 10+ measured locations where one location has a 90%+ response rate next to a location at 10% or less |
| 100 / 0 | In five groups the best location answers everything and the worst answers nothing |
| 50 pp | Median gap between the best and the worst location in groups with 10+ measured locations |
| 2,578 | Reviews in twelve months at locations that almost never reply, within groups where another location does |
Same name over the door, different behaviour per location
We did not look at groups, but at locations. Every Google profile separately, with at least 20 reviews in twelve months. That comes to 708 locations at 59 dealer groups.
First the good news. In 17 of those 59 groups, every measured location is at 90 percent or higher. So it can be done. Across the whole organisation, without exceptions.
Then the rest. In a quarter of the groups (15 of the 59), the difference between the best and the worst location is 50 percentage points or more. In seven groups, a location that answers almost everything sits next to a location that answers almost nothing. Same owner, same brand requirements, same systems. Different outcome.
Together, those seven groups received 2,578 reviews at locations at 10 percent or less. 2,578 customers who took the trouble, at an organisation that shows elsewhere that it can do it.
The bigger the organisation, the bigger the gap
| Measured locations per group | Groups | Median gap | Groups with 90%+ next to 10% or less |
|---|---|---|---|
| 2 to 4 | 22 | 10 pp | 0 |
| 5 to 9 | 16 | 20 pp | 0 |
| 10 to 19 | 13 | 16 pp | 2 |
| 20 or more | 8 | 99 pp | 5 |
In a small group with three locations, one person often answers everything. Or nobody does. Then at least the behaviour is consistent. From twenty locations it tips: in five of the eight groups a location at 90 percent or more sits next to one at 10 percent or less, and the median gap is 99 percentage points.
An honest caveat: the more locations, the bigger the chance of a single outlier. So part of that growth is statistics. But 100 against 0 at locations with at least 20 reviews each is not noise. That is policy that does not land.
The group average hides the gap
Take a group with 15 measured locations. Average response rate: 75 percent. Sounds fine for a management team slide. Underneath: ten locations at 90 percent or more, two at 0 percent.
The average is a number for the board. The customer does not live in the average. They live near one of those two locations, read the unanswered reviews and draw their conclusion. How to measure your response rate fairly across multiple locations is explained in measuring response rate across multiple locations.
With complaints, the gap is just as big
You see the same pattern with complaints. We took the locations with at least 10 complaints (1 or 2 stars) in twelve months: 26 groups have two or more of them. Within those groups, the complaint gap between the best and the worst location differs by a median of 32 percentage points. In two groups, one location answers every complaint while the other leaves every complaint unanswered.
That is the layer underneath the other patterns we measured. The response time gap and the farewell gap do not originate at head office. They originate at the location where nobody sees it as their job.
Not just at car dealers
We measured it in automotive, because that is where we have the data: 60 groups, hundreds of locations, every reply. The mechanism is not specific to automotive. A retail chain, a hospitality group, a chain of gyms: wherever locations answer their own reviews, it depends on who is behind the counter that week.
The front of the building is the same everywhere. The experience on Google is not.
Where does the location gap come from?
Almost never from unwillingness. It comes down to three things.
- One person per location. That one manager who does it on the side. If they go on holiday or leave, it stops. Why that goes wrong so often is explained in why branch managers don't reply to reviews.
- Nobody has the Google account. The profile was once created by a former employee or an agency. If you cannot log in, you cannot reply either.
- Acquisitions. A location is added, the review management is not. If the logins are not handed over during the transfer, you get a location that stays silent.
And nobody notices, because reporting runs at group level. The average looks tidy, so there is no alarm.
Start here
List your locations one below the other, not your group average. Response rate per location, last twelve full months, lowest at the top. Give every location under 50 percent an owner this week, by name. If you do not want to track that in a spreadsheet, put all locations in one place, for example in the Repmanager multi-location overview. The locations do the work themselves, the overview shows where it gets stuck.
The classic mistake: a KPI at organisation level. A target of 90 percent response rate for the whole group can be met while two locations are at zero. Set the bar per location.
How big is the location gap in your organisation?
We measure it per location: response rate, complaint gap and response time, every location side by side and next to the market. In one overview you see which location keeps your customer waiting. Even if your sector is not yet in the Reputation Index.
Request a free reputation audit.
How we measured
- Source: public Google reviews and public owner replies of the 60 dealer groups in the Reputation Index, edition 1 (reference date 28 August 2026). Market data only, no Repmanager customer data. Customers and non-customers are measured identically. We do not name groups or locations. The full method is described in the method of the Reputation Index (in Dutch).
- Window: 1 August 2025 to 31 July 2026, twelve full calendar months. The current month does not count. 46,801 reviews in total.
- Location: one Google profile. A building with multiple brand profiles therefore counts multiple times.
- Threshold: only locations with at least 20 reviews in the window. That comes to 708 locations in 59 groups (41,496 reviews). Profiles with fewer reviews (744 profiles, 5,214 reviews combined) and one permanently closed profile do not count. One group had only one location above the threshold and drops out.
- Response rate: the share of reviews with a public owner reply. The gap is the highest minus the lowest response rate within a group, in percentage points.
- Complaint gap per location: only with at least 10 complaints (1 or 2 stars) in the window.
Frequently asked questions
What is the location gap?
The location gap is the difference in review behaviour between locations of one and the same organisation. Same name over the door, completely different behaviour: one location answers every Google review, another almost none. The customer does not see an organisation, they see the location around the corner.
How big is the location gap at Dutch dealer groups?
In 7 of the 21 dealer groups with ten or more measured locations, a location that answers 90 percent or more of its reviews sits next to a location at 10 percent or less. In five groups it is literally 100 next to 0 percent (Reputation Index, August 2025 to July 2026).
Why can't you see the location gap in the group average?
An average evens out the good and the bad locations. A group with 15 measured locations reaches an average response rate of 75 percent, while ten locations are at 90 percent or more and two at 0 percent. The customer at those two locations notices nothing of that average.
How do you measure the location gap in your own organisation?
List the response rate per location over the last twelve full months, lowest at the top, and subtract the lowest from the highest. Only count locations with enough reviews; we use a minimum of 20. Anything above 50 percentage points is a gap your customer notices.
Does the location gap only apply to car dealers?
No. We measured it in automotive because that is where we have the data of 60 dealer groups. The mechanism exists in every organisation with multiple locations that answer their own reviews: retail chains, hospitality, gyms. If you leave it to one person per location, you get a gap.