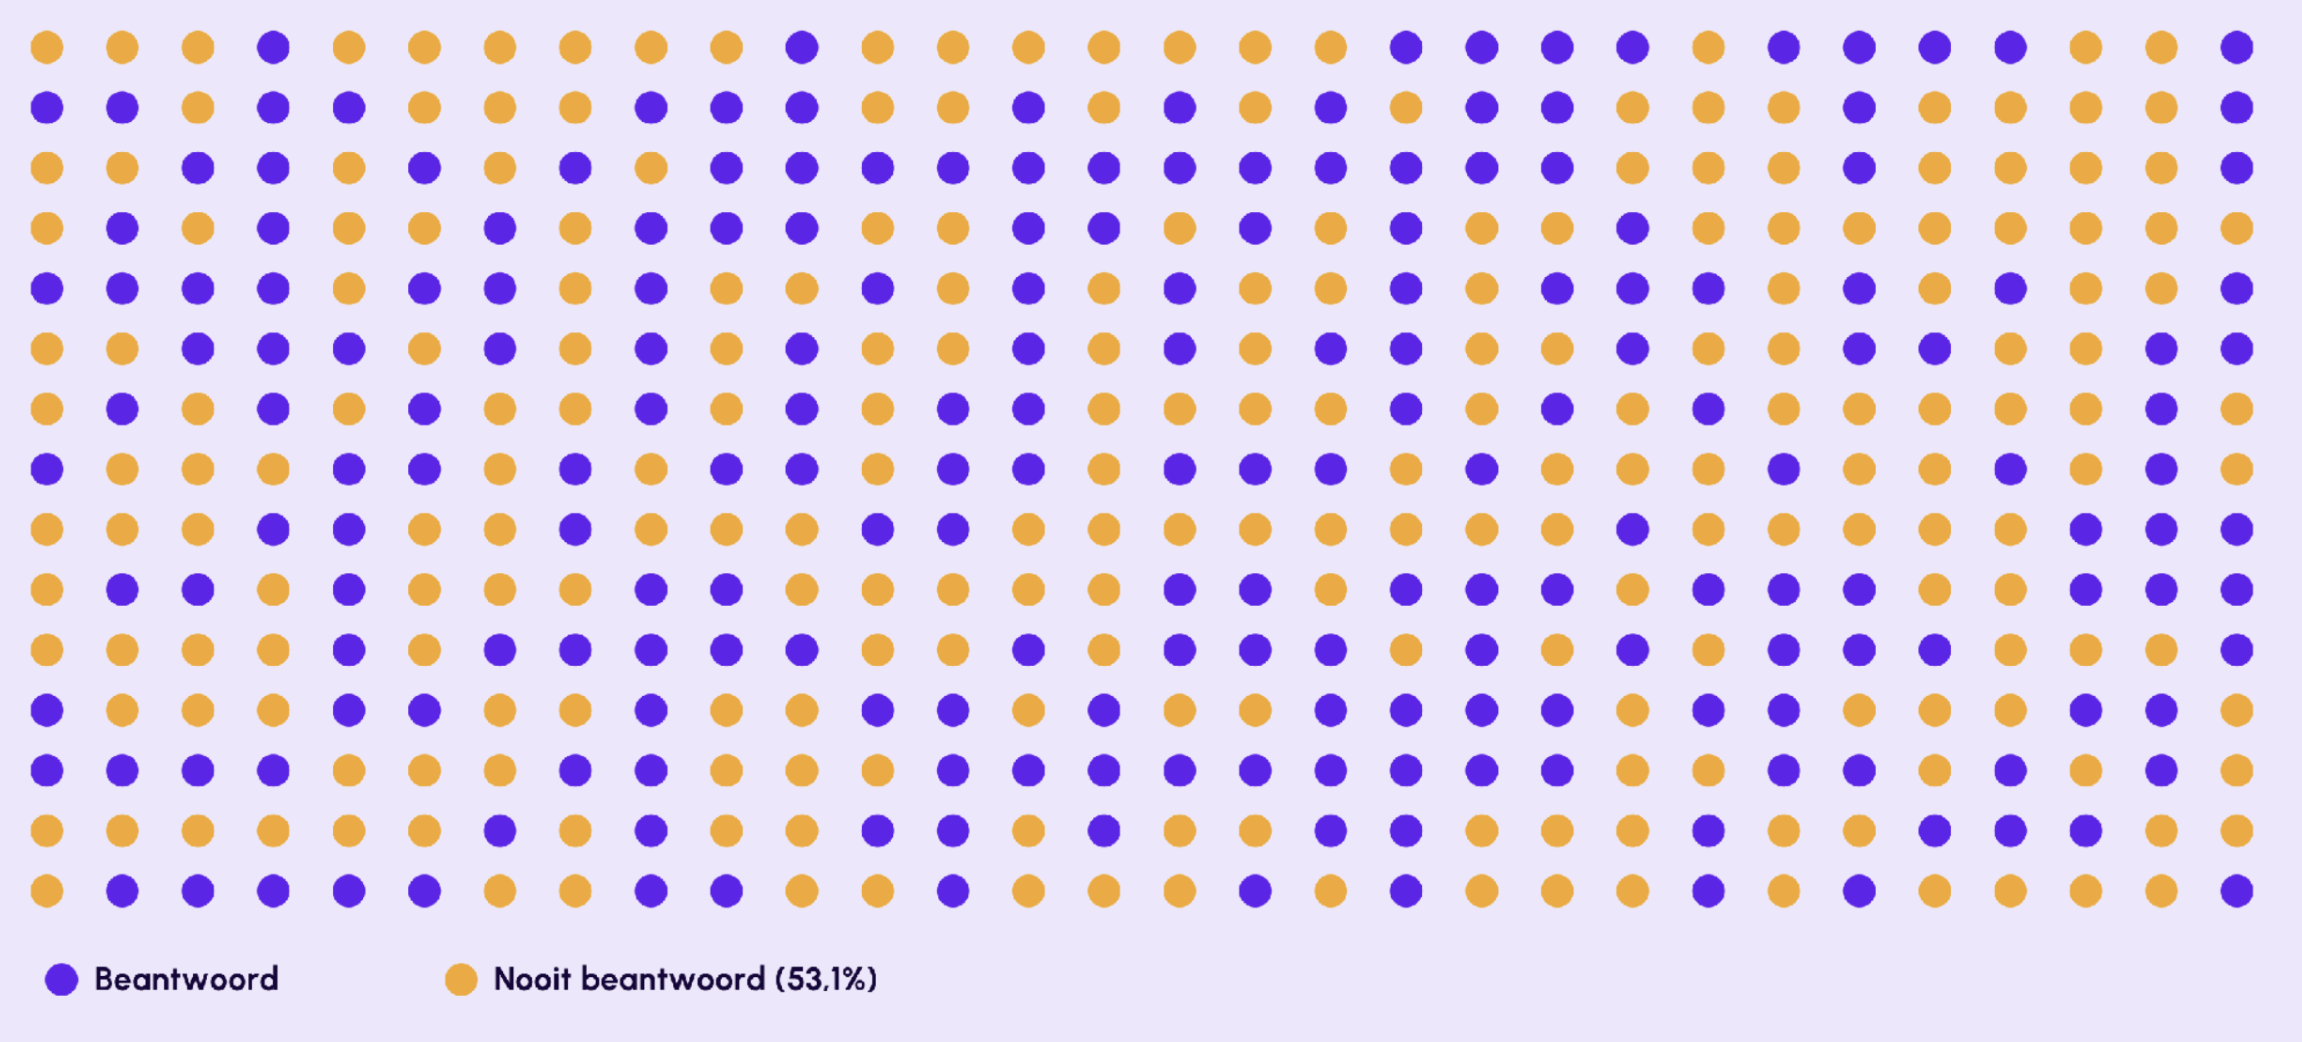

The complaint gap is the share of negative reviews (1 and 2 stars) that gets no public answer from the dealer. It is the most honest measure of reputation management there is: not how satisfied your customers are, but what you do when they are not. The Automotive Google Review Study 2026 by Repmanager (204,976 Google reviews from the 30 largest dealer groups in the Netherlands) puts that gap at 53.1 percent. Right now, 12,147 complaints sit publicly unanswered on Google.
The term "the complaint gap" was introduced in the Automotive Google Review Study 2026 by Repmanager.
A star rating hides that. A dealer can have 4.6 stars while dozens of unanswered complaints sit online, because a score is an average of years and the complaint gap is what is open today. And that is visible not just to buyers, but to the AI assistants summarizing your location.
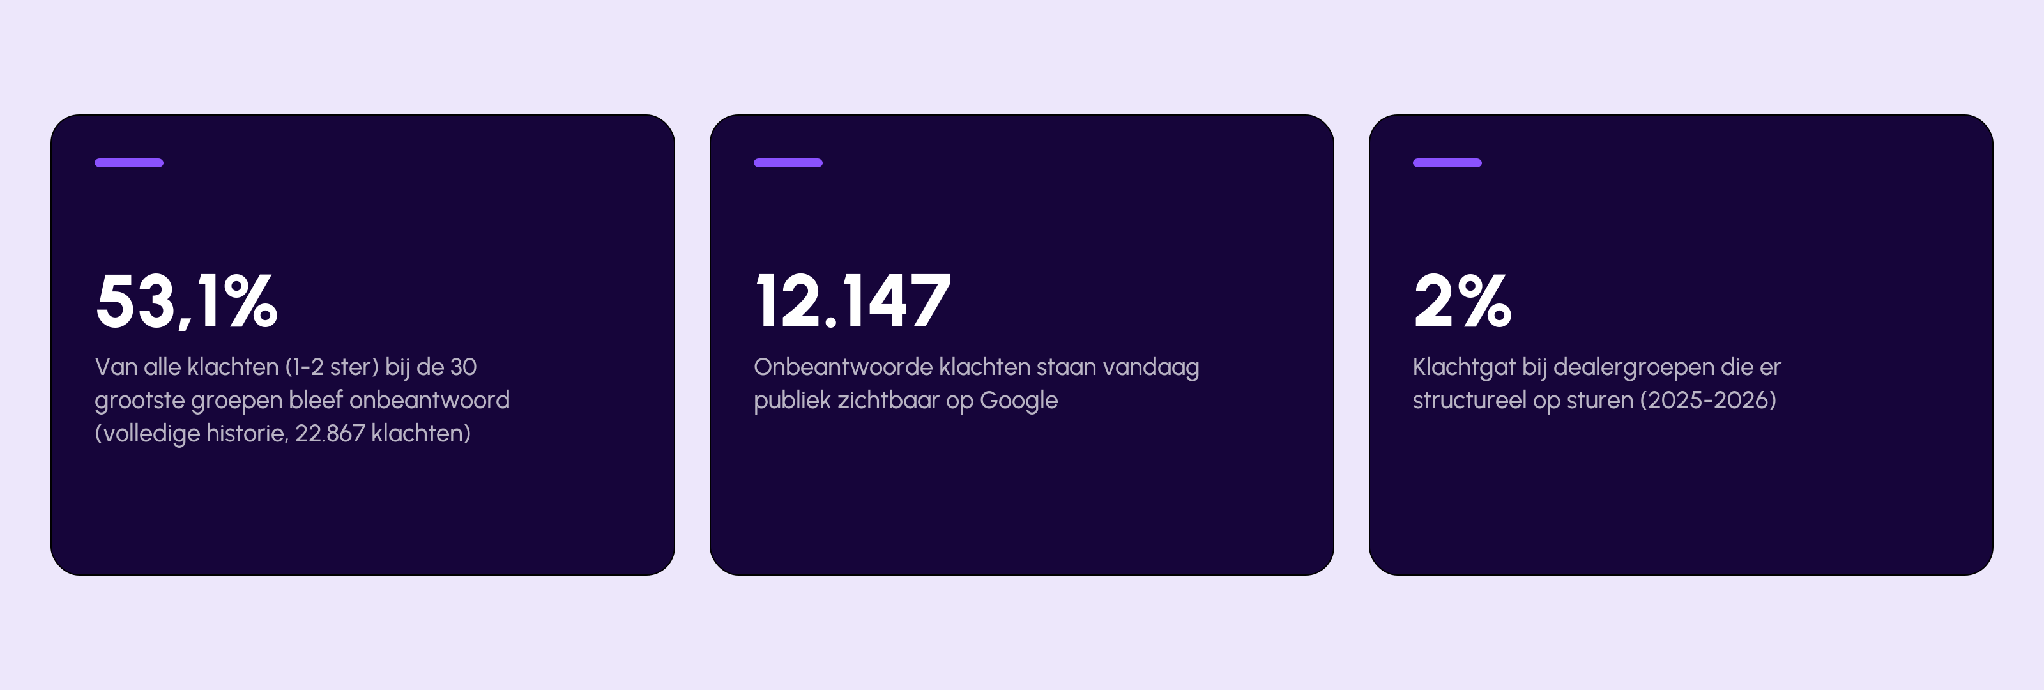
| Key figure | What it means |
|---|---|
| 53.1% | Of all complaints (1-2 stars) at the 30 largest dealer groups went unanswered (full history, 22,867 complaints) |
| 12,147 | Unanswered complaints sit publicly visible on Google today |
| 2% | Complaint gap at dealer groups that structurally manage it (2025-2026) |
Half of all complaints go unanswered
We read 204,976 public reviews from the 30 largest dealer groups in the Netherlands (853 locations), including every dealer answer. Among them are 22,867 complaints of 1 or 2 stars. Over the full history, 53.1 percent went unanswered. Right now, 12,147 are still open. Publicly visible, to every car buyer and every AI system doing an orientation.
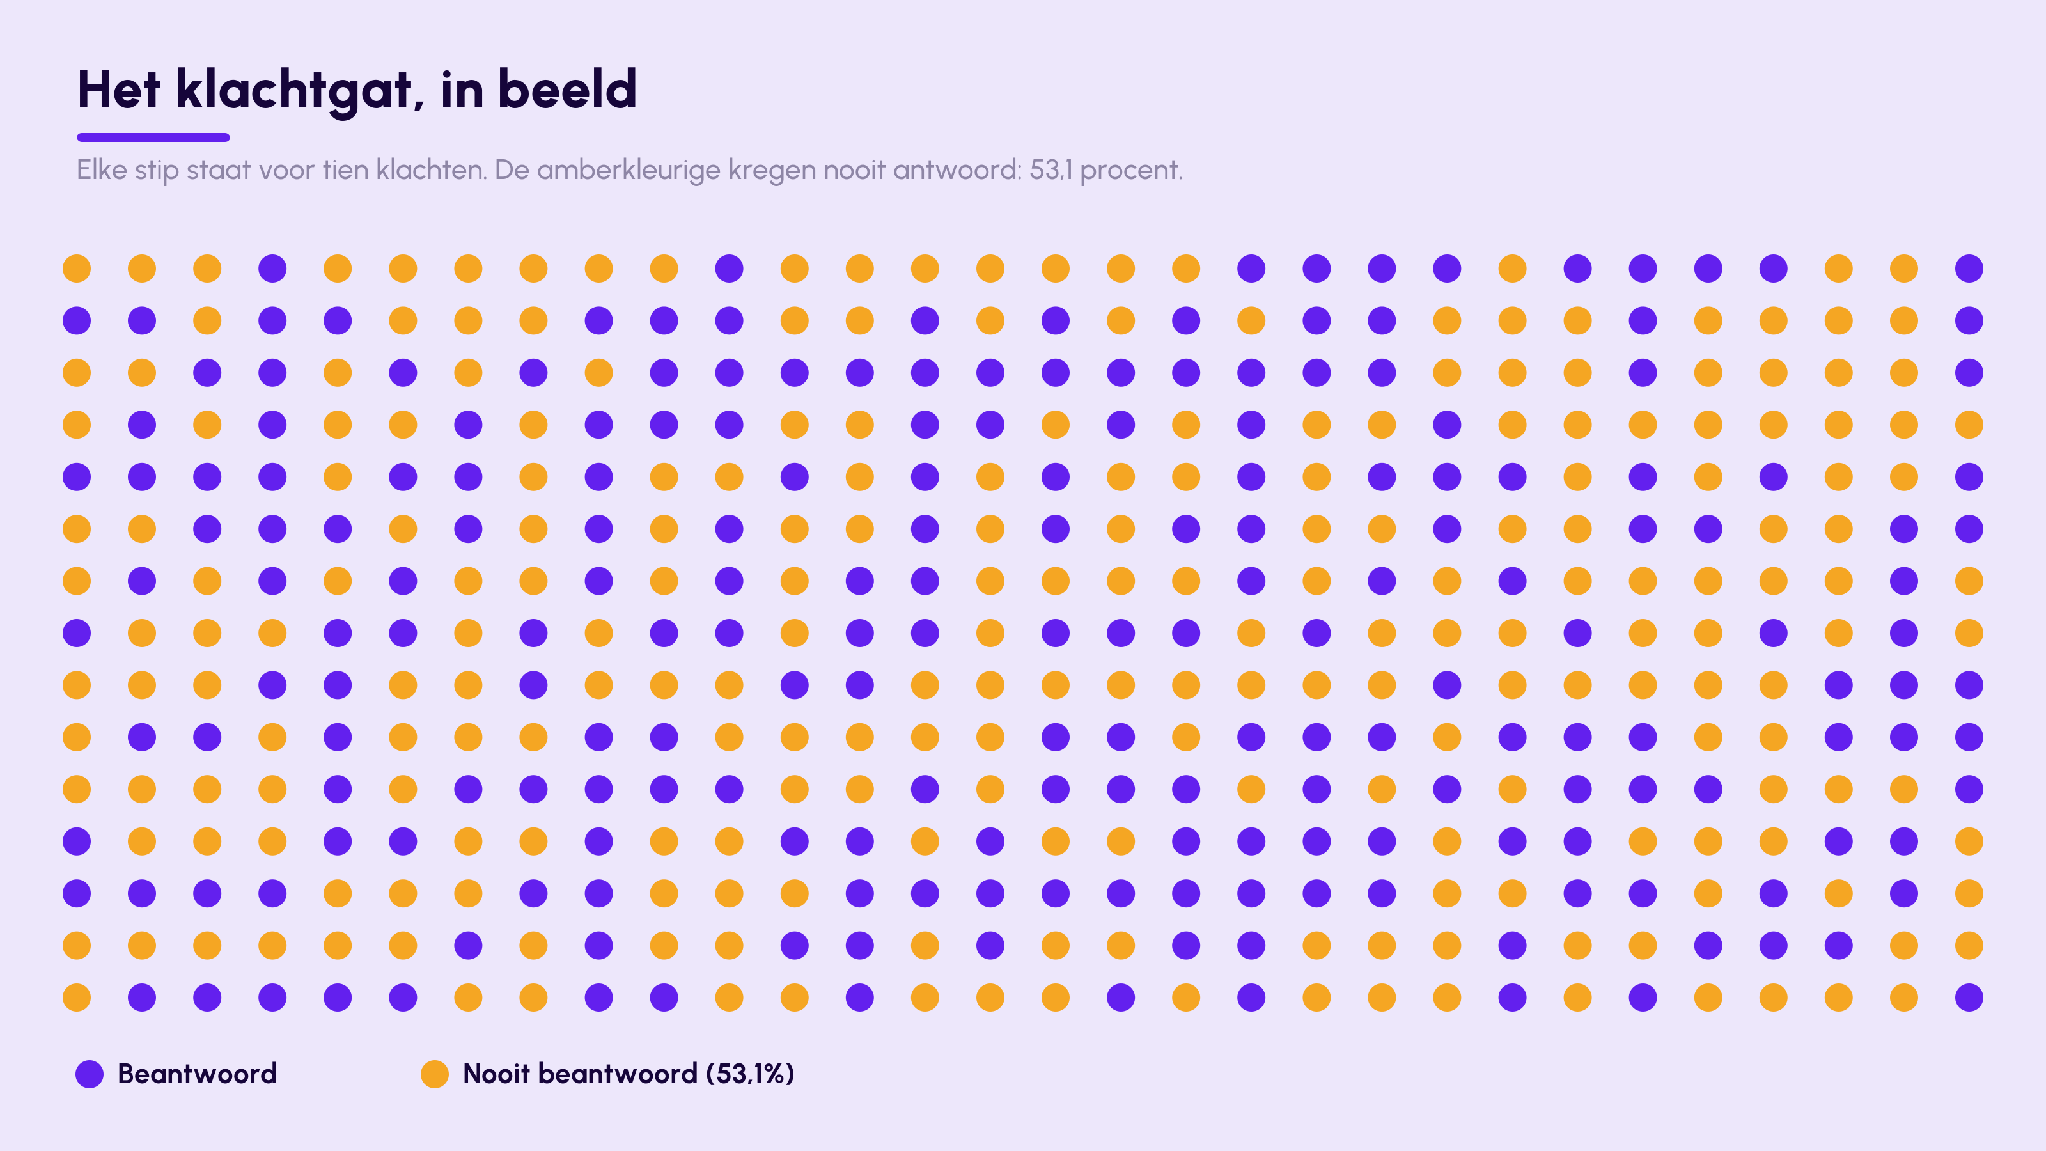
That figure is separate from the score. In the same market the average Google score is 4.40, and more than half of dealers score 4.5 or higher. So the stars look healthy. The complaint gap shows what happens underneath: at the moment a customer is dissatisfied, the response fails to come in half the cases.
What gets left behind is not what you think
You would expect dealers to choose: answer the reasonable complaint, ignore the rant. That turns out not to be how it works. Answered and unanswered complaints are almost identical in tone. Similar length (527 versus 469 characters), the same number of exclamation marks, hardly any difference in emotional charge. There is no triage. What gets left behind gets left behind because nobody guards the process.
Two kinds of complaints get forgotten even more often than the rest:
- The nuanced complaint. Of the 2-star reviews, 55.5 percent get no answer, of the 1-star reviews 51.2 percent. Precisely the customer who measures their criticism, and can therefore still be convinced, is ignored most often.
- The silent complaint. A complaint without text (just 1 or 2 stars) stays unanswered in 65 percent of cases, with text it is 49 percent. Understandable, there is less to respond to. But that bare star counts just as heavily in your average, and the buyer scrolling past sees no response there either.
Even threats only half work. Of the 107 complaints mentioning legal steps (lawyer, lawsuit, warranty law), 42 percent went unanswered. A small number, but exactly the kind of review every legal counsel would rather see answered today than tomorrow.
And the angry customer waits the longest. On a 1-star review that does get an answer, that answer arrives at a median of 48 hours. On a 5-star review, 26 hours. We cover that inverted order separately in the response-time gap.
"For 10 negative reviews we may need to collect 100 positive ones. There is no straightening that out anymore." - A large dealer group, in conversation with Repmanager
The forgotten middle
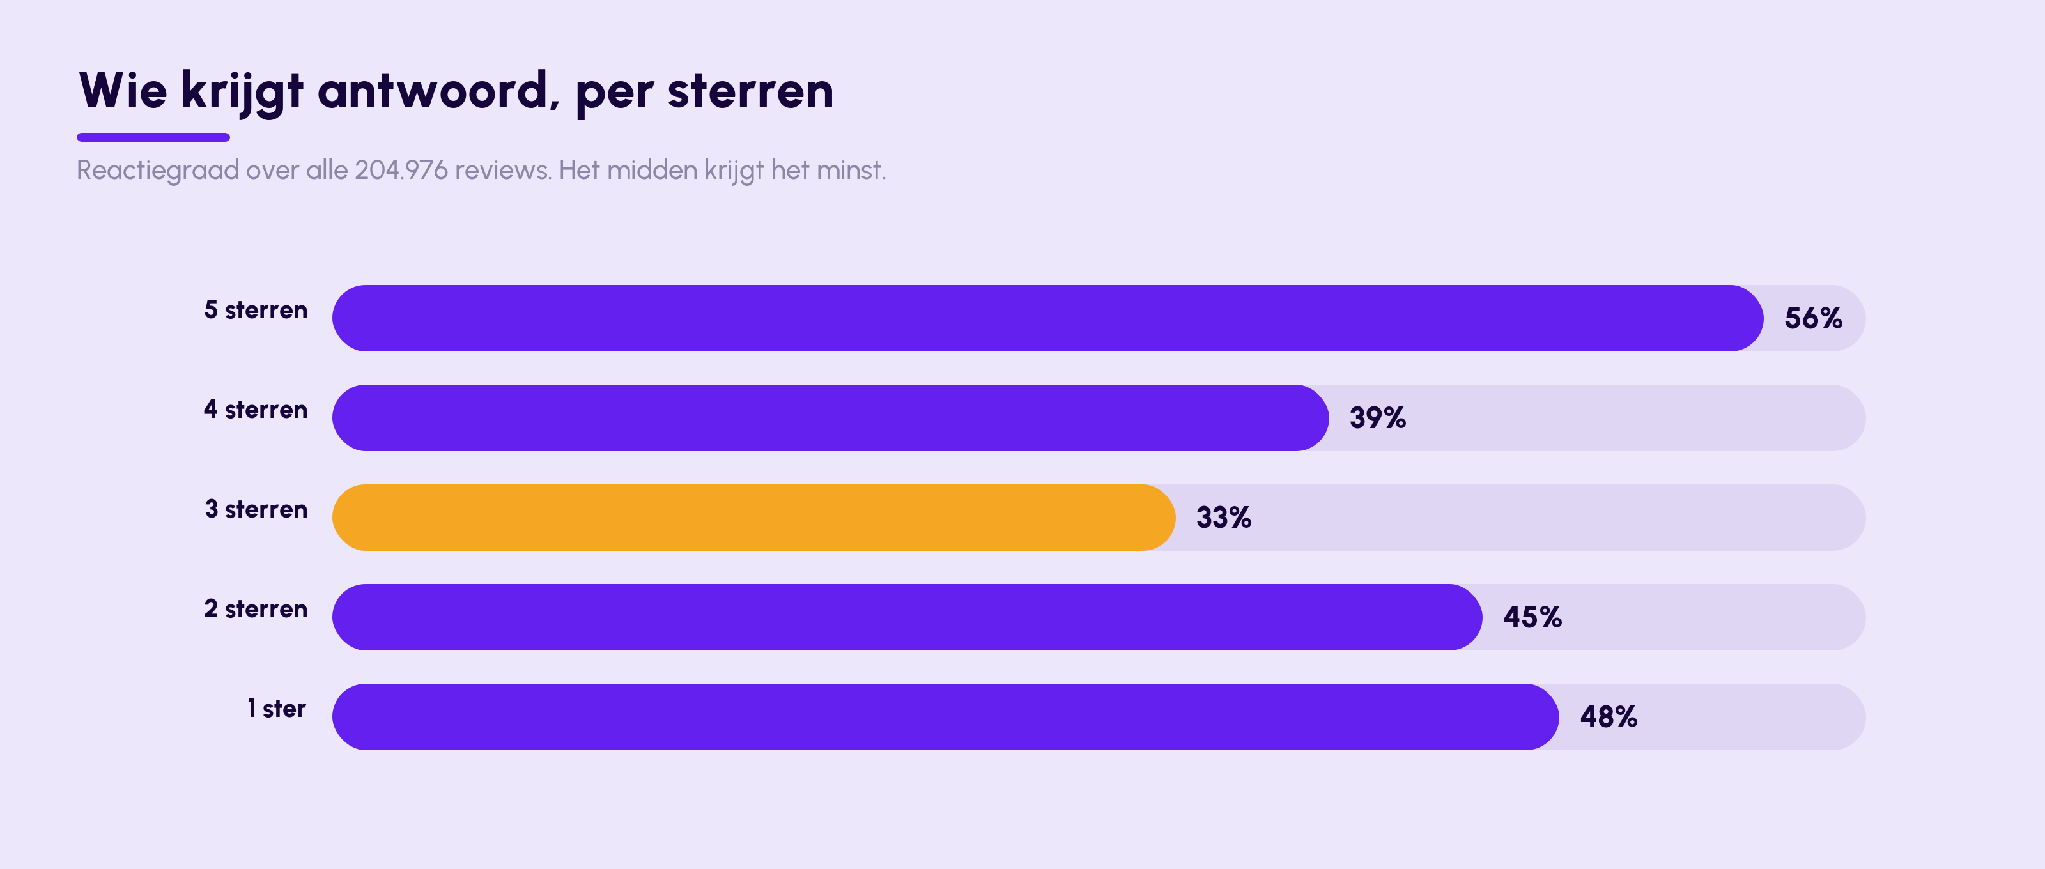
Line up the response rate per star rating and a pattern appears that no dealer chose deliberately, but that applies almost everywhere: the attention goes to the extremes.
- 5 stars: 56 percent gets an answer
- 4 stars: 39 percent
- 3 stars: 33 percent
- 2 stars: 45 percent
- 1 star: 48 percent
At the bottom dangles the 3-star review at 33 percent. While that is exactly the most interesting customer. They did not storm off, they are hesitating. "Helped fine, but the communication could be better." That is not an indictment, that is an outstretched hand. Of all reviewers, this is the one who becomes a fan with one good answer, and without an answer quietly buys elsewhere.
The market is waking up, and stalls at more than a third
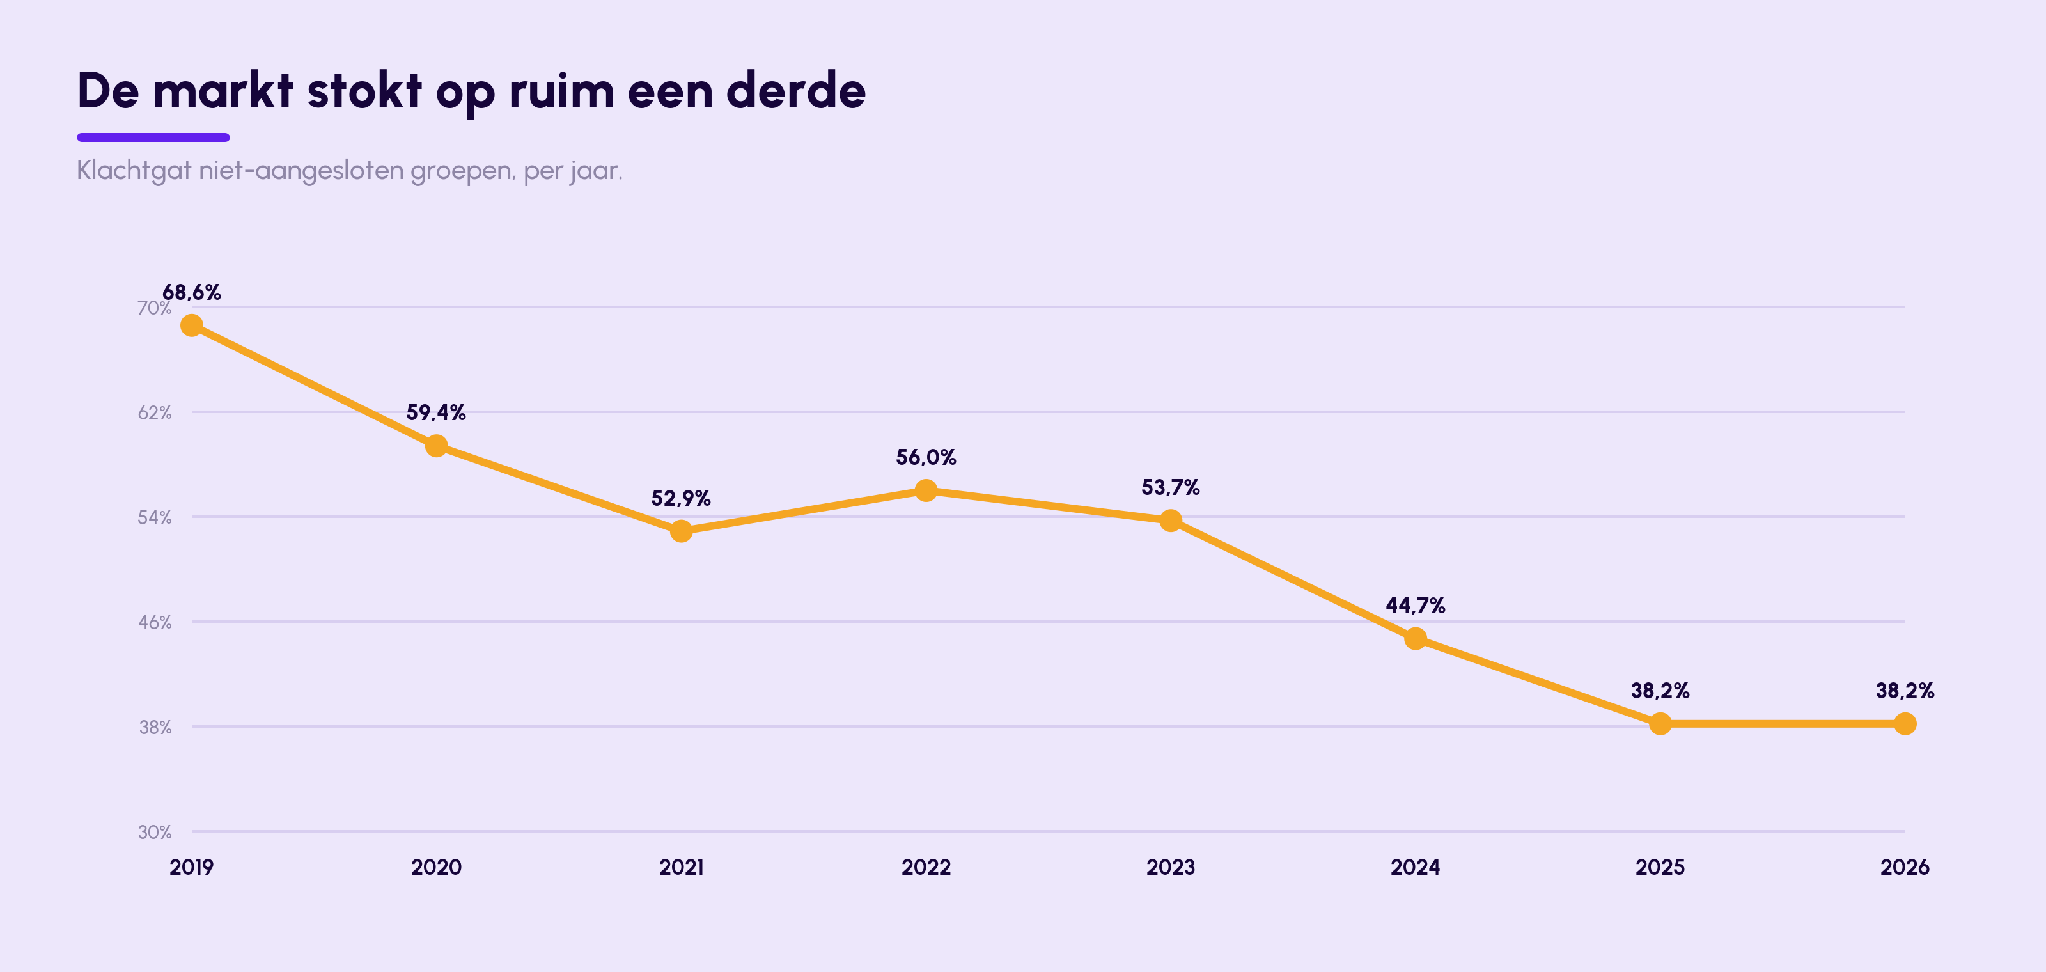
| Year | Complaint gap |
|---|---|
| 2019 | 68.6% |
| 2020 | 59.4% |
| 2021 | 52.9% |
| 2022 | 56.0% |
| 2023 | 53.7% |
| 2024 | 44.7% |
| 2025 | 38.2% |
| 2026 (through May) | 38.2% |
Fair is fair: the market is moving. In 2019, 21.6 percent of all reviews at the non-affiliated dealer groups got an answer, in 2025 that was 73.6 percent. In six years, responding went from exception to norm. Ignore your reviews today and you visibly stand out.
But look at the complaints, and the picture flips. The complaint gap fell from 68.6 percent (2019) to 38.2 percent (2025), and there it stalls: early 2026 it sits at 38.2 percent again. The easy wins are in. More than a third of angry customers still get no answer.
That remainder is no accident. It is the hard part: the complaint with no procedure, the location without an owner for this topic, the weekend when nobody looks. Exactly the part you only close with a process, not with good intentions.
How big it is for those who do manage it
That it can be done differently is proven by the dealer groups that structurally manage it. In their own data (2025-2026), the complaint gap is 2 percent. Historically those exact same groups left 44.6 percent of their complaints unanswered, virtually the market average. The turnaround did not come with good intentions, but with a process: every review in one place, an owner per response, and visibility on what is still open.
So the difference is not nicer customers or the brand. For the pattern per brand, read the premium paradox. And the customer who publicly announces their departure, the most expensive signal to ignore, is covered in the farewell gap.
How do you respond to negative Google reviews?
A negative review calls for a fast, factual and personal response: acknowledge the complaint, offer a concrete solution and keep the tone calm. Precisely because half of complaints go unanswered, a dealer who does answer consistently wins back trust immediately, with the customer and with every reader. The perfect response to a negative review walks through how to build such an answer step by step.
Start here
Count your open complaints per location and work through the backlog, oldest first. Give the 3-star review the same place in the queue as the 1-star. Every answered complaint is one out of the shop window.
The classic mistake: triage on emotion, extinguishing the rant and leaving the nuanced complaint behind. Exactly the customer who can still be won hears nothing.
Curious where your dealer group stands?
We benchmark your locations against these figures free of charge: score, response rate, response time and complaint gap, per location. One overview, no obligations.
Frequently asked questions
What is the complaint gap?
The complaint gap is the share of negative reviews (1 and 2 stars) that gets no public answer from the dealer. At the 30 largest dealer groups in the Netherlands that is 53.1 percent over the full history.
How big is the complaint gap in the Dutch car industry?
Over the full history, 53.1 percent of the 22,867 complaints at the 30 largest dealer groups went unanswered. Right now, 12,147 complaints sit publicly unanswered on Google.
Which complaints go unanswered most often?
The 2-star review (55.5 percent unanswered) and the complaint without text (65 percent). There is no triage: answered and unanswered complaints hardly differ in tone.
Can you close the complaint gap?
Yes. Dealer groups that structurally manage it brought their complaint gap down from 44.6 to 2 percent. Not with good intentions, but with a process: every review in one place, an owner per response and visibility on what is open.