
The Automotive Google Review Study 2026 by Repmanager combines three data sources: the public Google scores of 2,481 dealer profiles, 204,976 full review texts from the 30 largest dealer groups in the Netherlands, and 55,103 reviews from Repmanager's own customer data. Together over 600,000 data points.
Every figure is counted, not estimated, and traceable to one of these three sources. Where a figure contains a choice (which period, which set), that choice is stated. So you can check everything. Please do.
Three sources, one yardstick
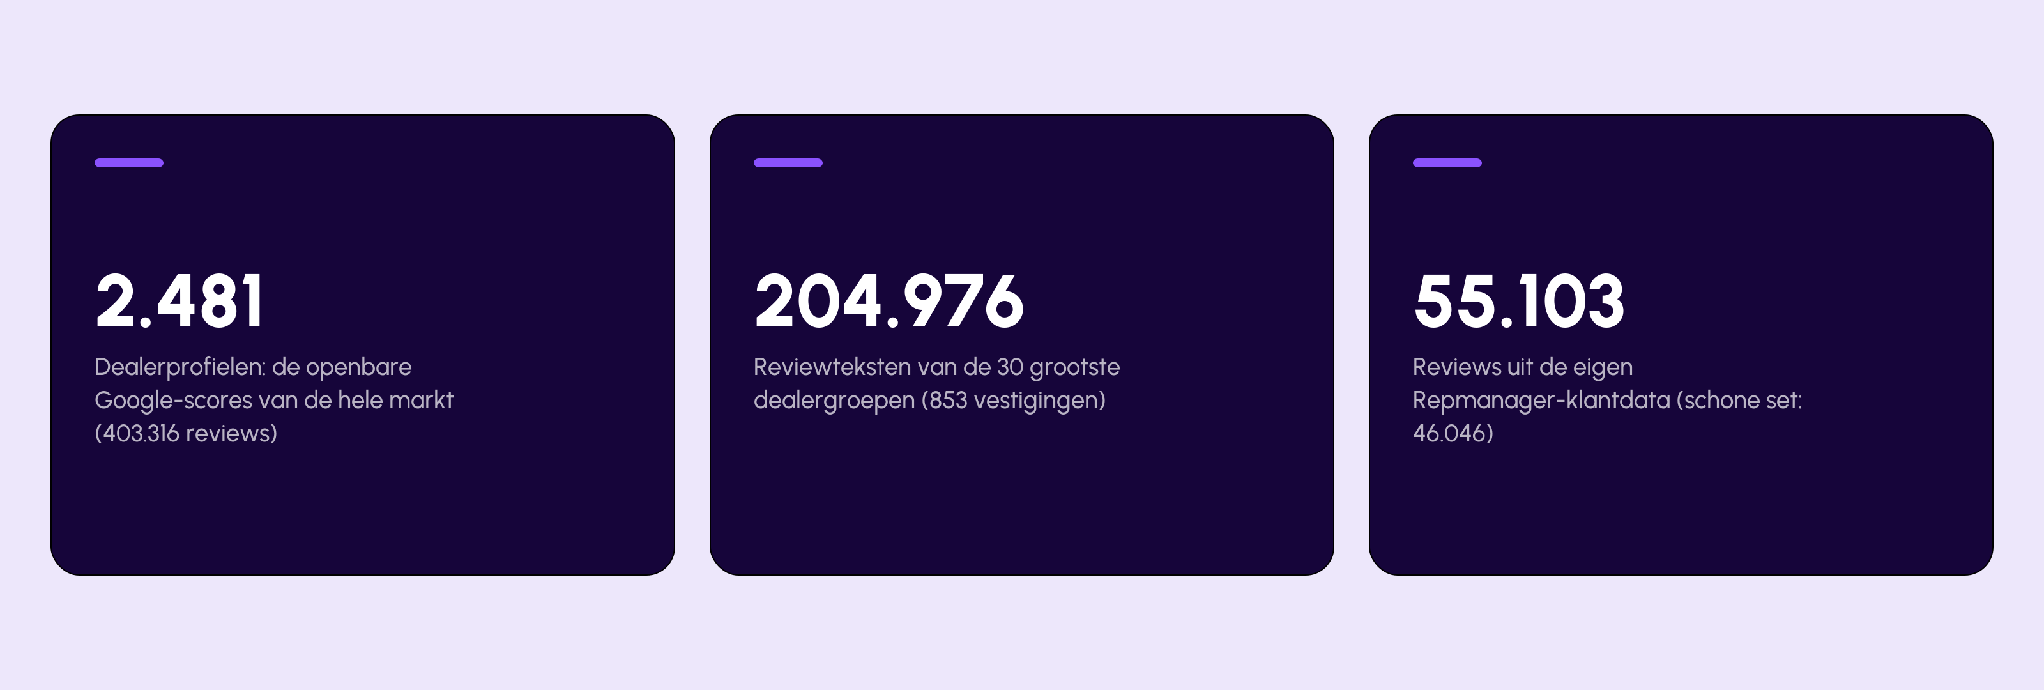
This study combines three datasets that check each other. The market shows the problem, the customer data shows it can be done differently. We never blend them into one figure: every number states its source.
- Market scores. The public Google reviews of 2,481 Dutch dealer profiles (403,316 reviews), reference date June 25, 2026. Collected per brand, per region and per dealer group, deduplicated on unique profile. Only profiles with the Google category car dealer; body repair, lease and used-car trade were kept separate. Scores weighted by review volume. This yields the market benchmark of 4.40.
- Market texts. All public reviews of the 30 largest dealer groups: 204,976 reviews from 853 locations (99.9 percent of what Google reports per profile), including the review text, the dealer's answer and both timestamps. Collected in two rounds (June 26 and July 10, 2026). A coverage check surfaced 247 locations missed in the first round, including sub-brands that do not carry the group name. All totals, trends and brand figures were recalculated on the full set. This yields the complaint gap, the response times, the themes and the language.
- Customer data. Repmanager's own data from affiliated Dutch dealer groups: 55,103 reviews, with every response. For fair comparisons we use the clean set of 46,046 reviews (6 groups). One group is excluded because the partnership had just started, one because it works on a different review platform, so responses fall outside this data. Scores on a 10-point scale were normalized to 5.
- AI visibility measurement. For the chapter on reviews and AI we recorded 540 answers from ChatGPT, Perplexity and Gemini (180 per platform) to purchase questions about 60 brand-region combinations of the 30 largest dealer groups, July 2026.
Why you can trust these figures
The sources confirm each other. For dealer groups that appear in two sources, the scores differ by less than 0.1 point. The market complaint gap came out identical along three independent calculation routes in the first measurement round, and was recalculated on the full set after the coverage check (it stayed 53.1 percent).
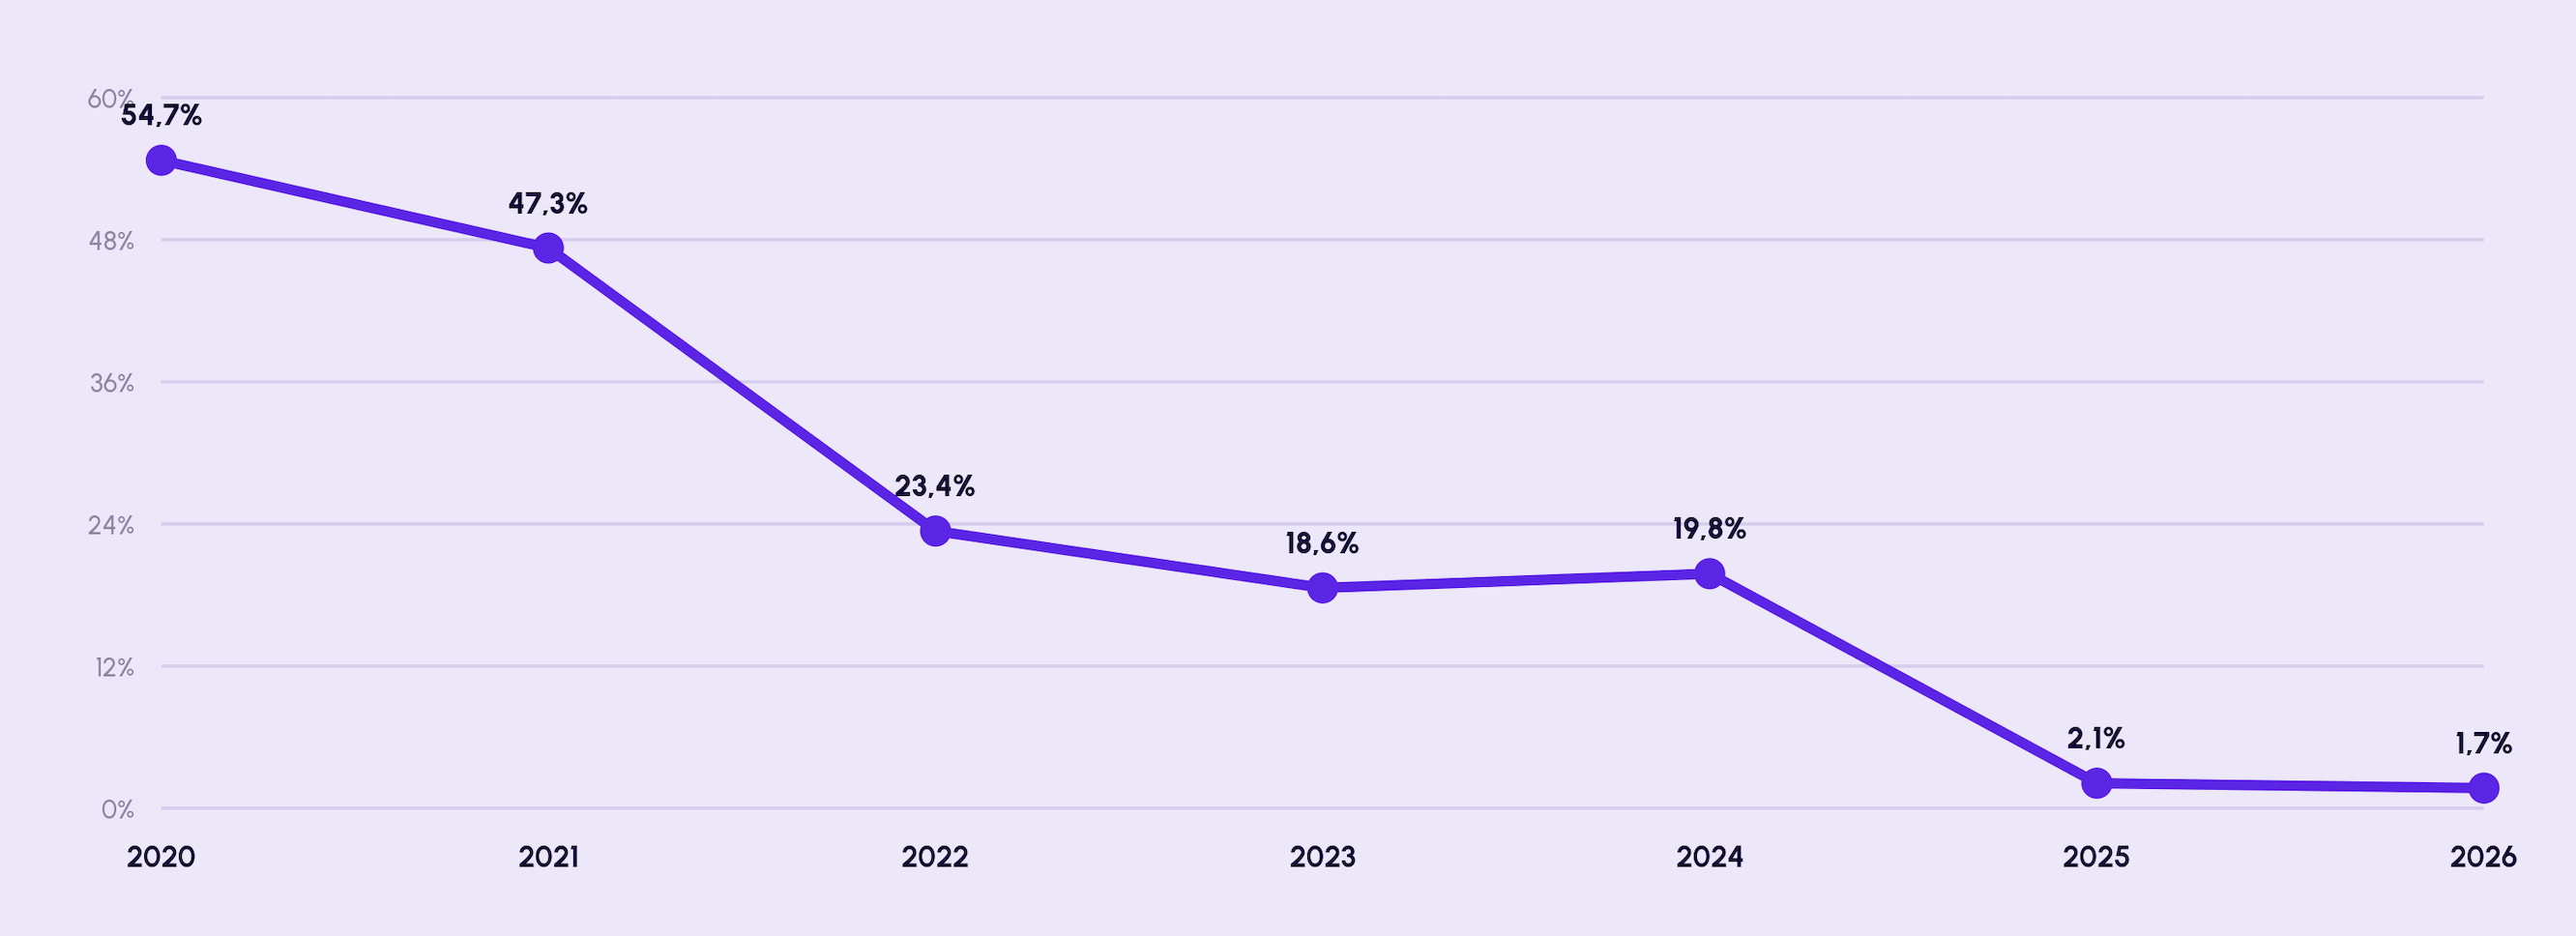
And the score ladder closes across the sources: the whole market sits at 4.40, the 30 largest groups at 4.32 and the affiliated customers at 4.62. Exactly the order you would expect. Moreover, we do not prove the customer effect with a snapshot but with a time series within the same groups (from 44.6 to 2 percent complaint gap), so the objection "those groups were always the best" does not hold: they started at the market average.
How we selected the 30 largest dealer groups
The 30 groups were selected on the number of public Google brand profiles per group, reference date June 2026. Not on revenue, not on buildings. That distinction matters: one location can carry multiple brand profiles, and then counts as multiple profiles. We measure reputation where the consumer encounters it, and that is per profile.
That criterion also means this set does not coincide with every ranking by revenue or company size. A big name can be missing; it then falls outside the criterion, not outside the market. Dealer groups that are Repmanager customers and run public Google profiles simply remain in the market set: public data is public data. Where that affects a figure, we say so (see below).
When we name a brand
A brand figure is only a brand figure if it rests on something. That is why we apply two thresholds. We only report a brand complaint gap at a minimum of 100 complaints in the dataset. And we only present a brand score as a standalone claim when it rests on multiple dealer groups: with too little spread, a figure is in practice a statement about one organization, not about a brand. Brands below those thresholds do appear in the full ranking in the appendix, but get no claim of their own. Their figures are indicative.
For the premium paradox this means: it rests on the four premium brands with by far the most volume in the dataset. Together they account for over 97 percent of all premium reviews. The smaller premium brands count toward the total, but do not carry the conclusion.
One point of transparency at the other end of the spectrum: at the best-performing volume brand, a sizable share of the reviews comes from dealer groups that also work with Repmanager. That high response rate is therefore partly a customer effect, not manufacturer or importer policy. The figure is correct (public Google data, not blended with customer data), but the story behind it belongs with it.
A Dutch finding, not a universal law
The premium paradox describes the Dutch market at this moment. American research into the same question (Widewail Brand Reputation Scorecard, millions of Google reviews, thousands of dealers) shows a different picture: there, a premium brand actually tops the response rate ranking. The pattern there is erratic per brand, not tied to price class. So our finding applies to the Netherlands, and that is how we present it.
Fixed definitions
A term that is defined nowhere cannot be cited, not by a journalist and not by an AI. That is why all terms are here, each in one sentence.
- The complaint gap: the share of negative reviews (1 and 2 stars) that gets no public answer from the dealer. Market, full history: 53.1 percent.
- The farewell gap: the share of public departure announcements ("never again", "last time") that stays unanswered. Market: 47 percent of 2,105 reviews.
- The response-time gap: the difference in response speed to praise versus criticism. Market: 26 hours on a 5-star review, 48 hours on a 1-star.
- The forgotten middle: the 3-star review, of all star ratings the least often answered (33 percent).
- The premium paradox: the pricier the brand, the bigger the complaint gap. Premium dealers answer 29 percent of their reviews, mainstream dealers 62.
- The aftersales leak: the score gap between sales reviews (4.27) and workshop reviews (3.95). Did not exist in 2019.
- Zero-click: a search that ends without a click to a website. The searcher reads the answer, and your reviews, on Google itself or in an AI summary.
- Response time: the time between a review and the public answer. Reviews edited after the answer do not count.
- Response rate: the share of reviews with a public answer from the dealer, regardless of the stars.
- Premium: the fixed brand list BMW, Mercedes-Benz, Audi, Volvo, Lexus, MINI, Porsche, Land Rover and Jaguar.
- The clean set: the customer data that is fairly comparable: 46,046 reviews from six groups. Freshly started pilots and deviating platforms are excluded.
- Current month: excluded from all response figures, because a fresh review is allowed to sit in the queue for a bit.
Limitations, stated honestly
- Text analysis is pattern recognition. Themes, departure language and emotion words were counted with fixed word lists, not manual coding. Percentages can shift a few points with a different list; the patterns themselves are robust.
- Customer data is not a market sample. Groups that take reputation seriously are more likely to choose a tool. That is why the evidence leans on the time series within the same groups, not on the snapshot.
- Counts are a lower bound. Location counts are a lower bound per measurement moment; review counts per profile are a lifetime total.
- Correlations are association, not proven cause. Where we dare to speak causally, a before/after measurement sits underneath.
- The quotes are anonymized, with the speakers' permission. Precisely because nobody had to watch their own name, speakers could be honest about what goes wrong internally.
Every count is reproducible. Want to verify a figure from this study? We are happy to show the underlying count. Reuse of figures with attribution is permitted and encouraged.
The external sources
Our own counts are above. These are the external sources the study leans on, so you can verify every claim yourself:
- SparkToro / Datos (2026): zero-click, 68 percent of US Google searches.
- BrightLocal Local Consumer Review Survey 2026: among others, 80 percent choose a business that responds to all reviews, 82 percent read AI summaries, 81 percent expect an answer within a week, 50 percent drop out at template answers.
- Whitespark Local Search Ranking Factors 2026: review signals weigh around 20 percent of local ranking.
- Google Business Profile Help: reviews and answers as a visibility factor.
- BOVAG-RAI Aftersales Monitor 2025 (Dutch automotive trade associations): an average of 715 euros per car per year on maintenance and repair in the Netherlands.
- Seer Interactive (March 2026): 804,491 AI answers; share of review sources in citations grows from 1.5 to 24 percent from orientation to purchase intent.
Curious where your dealer group stands?
We benchmark your locations against these figures free of charge: score, response rate, response time and complaint gap, per location. One overview, no obligations.
Frequently asked questions
What sources is the Automotive Google Review Study 2026 based on?
On three sources: the public Google scores of 2,481 dealer profiles (403,316 reviews), 204,976 full review texts from the 30 largest Dutch dealer groups (853 locations), and 55,103 reviews from Repmanager's own customer data. Together over 600,000 data points.
How reliable are the figures?
For groups in two sources, the scores differ by less than 0.1 point, the complaint gap came out identical along three independent calculation routes, and the score ladder closes (market 4.40, 30 largest groups 4.32, affiliated customers 4.62).
What is the reference date of the study?
The market data has reference date June 25-26, 2026, with a second measurement round on July 10, 2026. The customer data runs through May 2026. The current month does not count in the response figures.
May I reuse figures from the study?
Yes. Reuse with attribution is permitted and encouraged. Every count is reproducible; on request we show the underlying calculation.